What is an Agent?
After deploying an agent to AgentOS, it appears in the Agents List (/agents/) with an Online status. Click the Manage button to access the agent’s detail page where you can monitor, test, and manage your agent.
Each deployed agent gets:
- Dedicated API endpoint (IP:port)
- Automatic OpenAPI documentation
- Execution history tracking
- Performance metrics
- Scheduling capabilities
Management Page
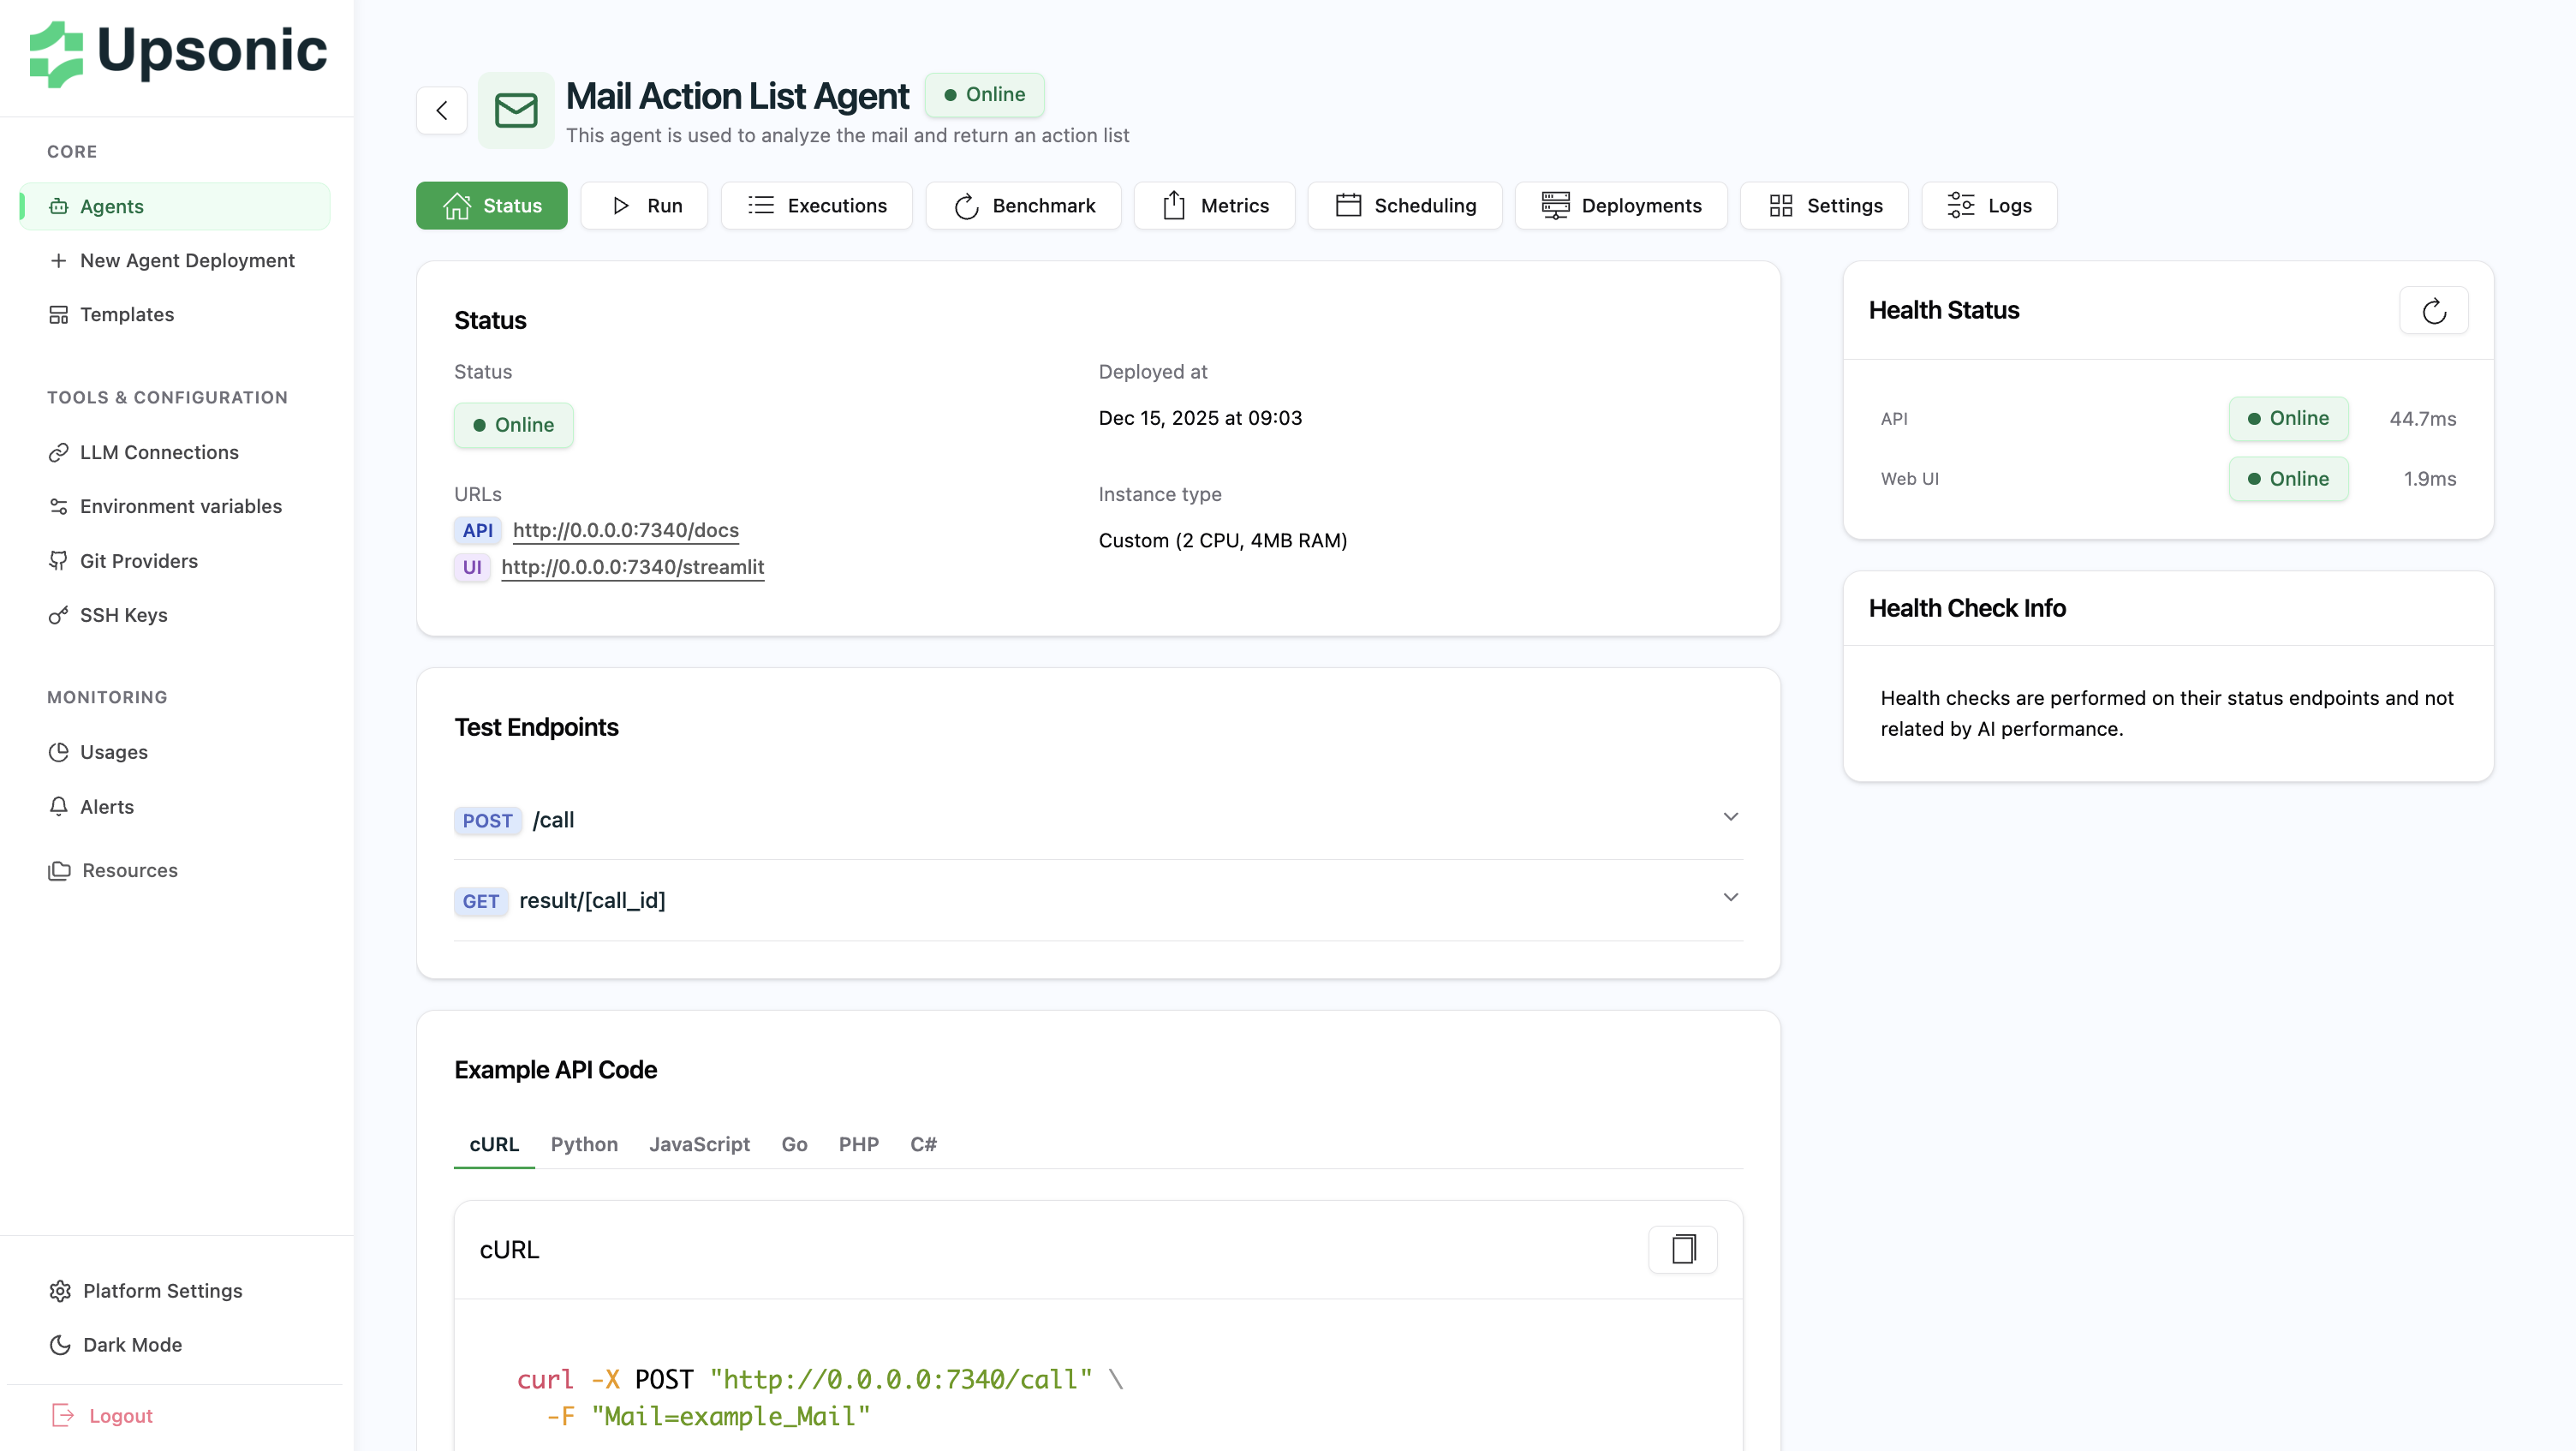
The agent management page provides complete control and visibility into your agent’s operations.API Endpoint
Each agent is assigned a unique IP and port. For local environments:- First agent:
http://0.0.0.0:7340 - Subsequent agents: Sequential ports (7341, 7342, etc.)
Making API Calls
Call your agent using the/call endpoint:
What You’ll See
The management page displays:- Health Status - API and Web UI health checks
- API Endpoint - Direct link to
/docsfor OpenAPI documentation - Example Code - cURL, Python, JavaScript, and other language examples
- Streamlit UI - Access to the Streamlit interface (if available)
- Test Endpoints - Interactive API testing interface
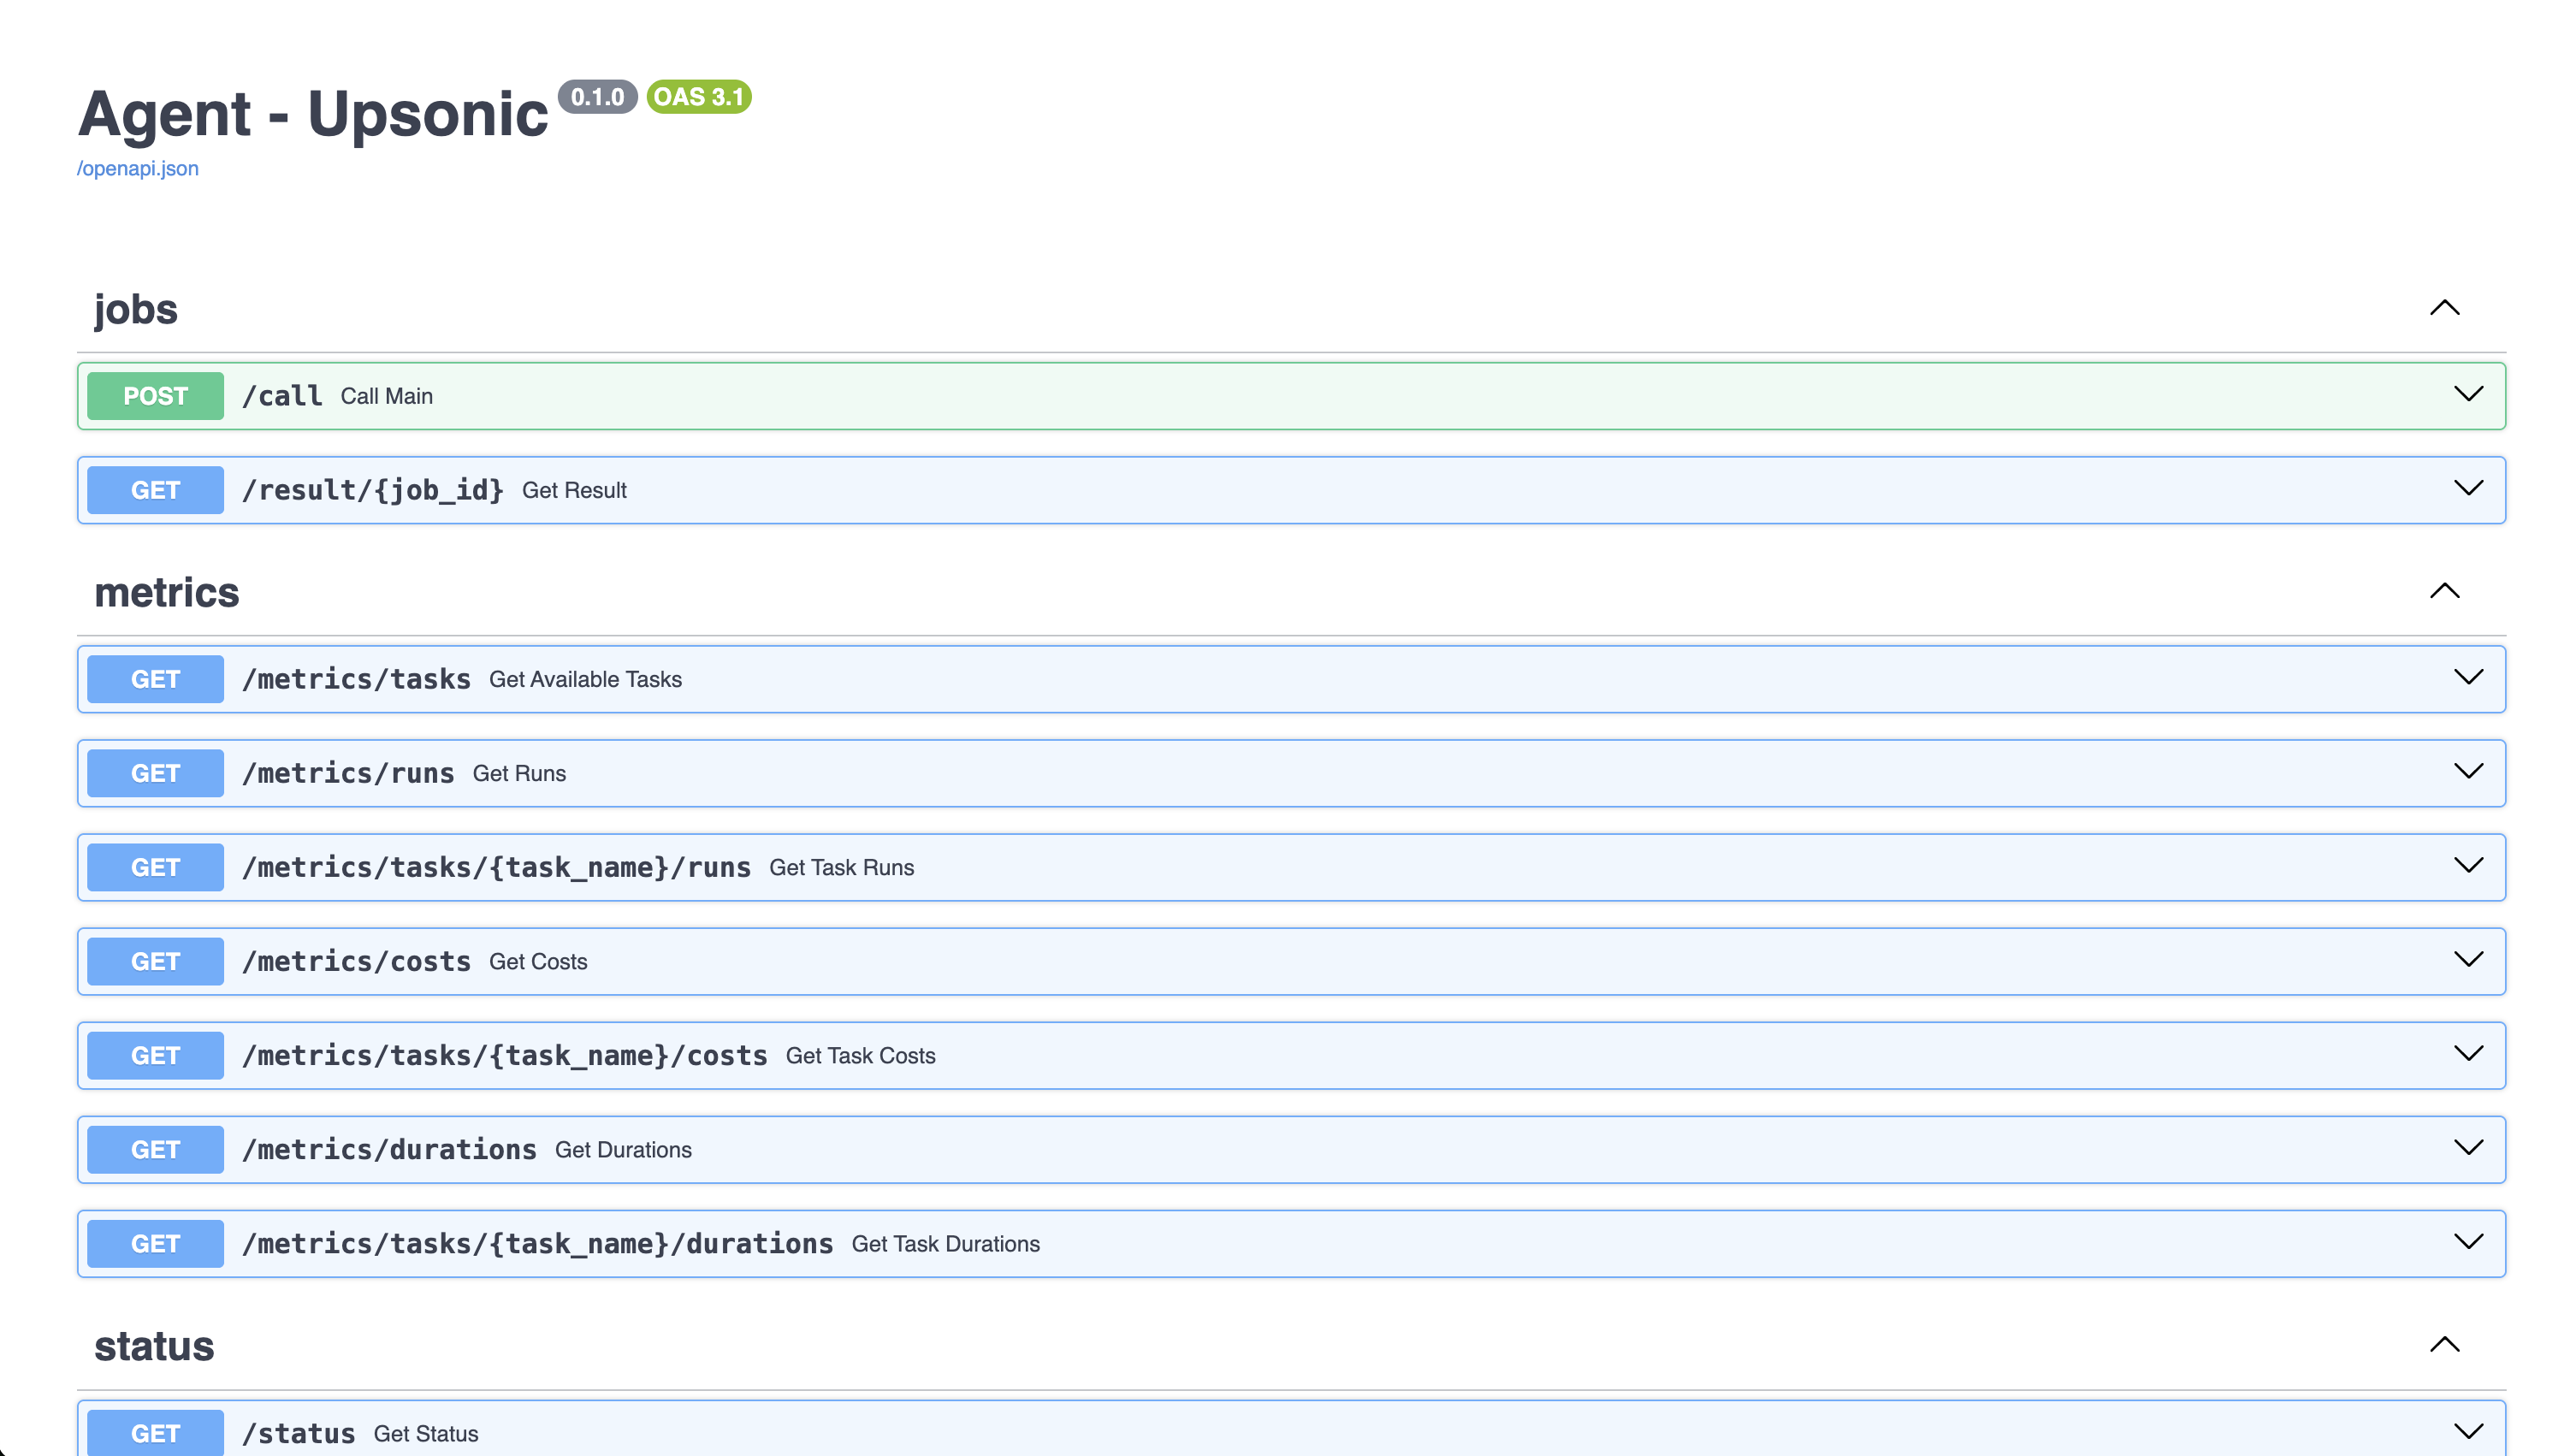
OpenAPI Documentation
Every agent automatically generates OpenAPI documentation. Access it at:- Interactive API testing interface
- Request/response schemas
- Authentication details
- Example requests in multiple languages
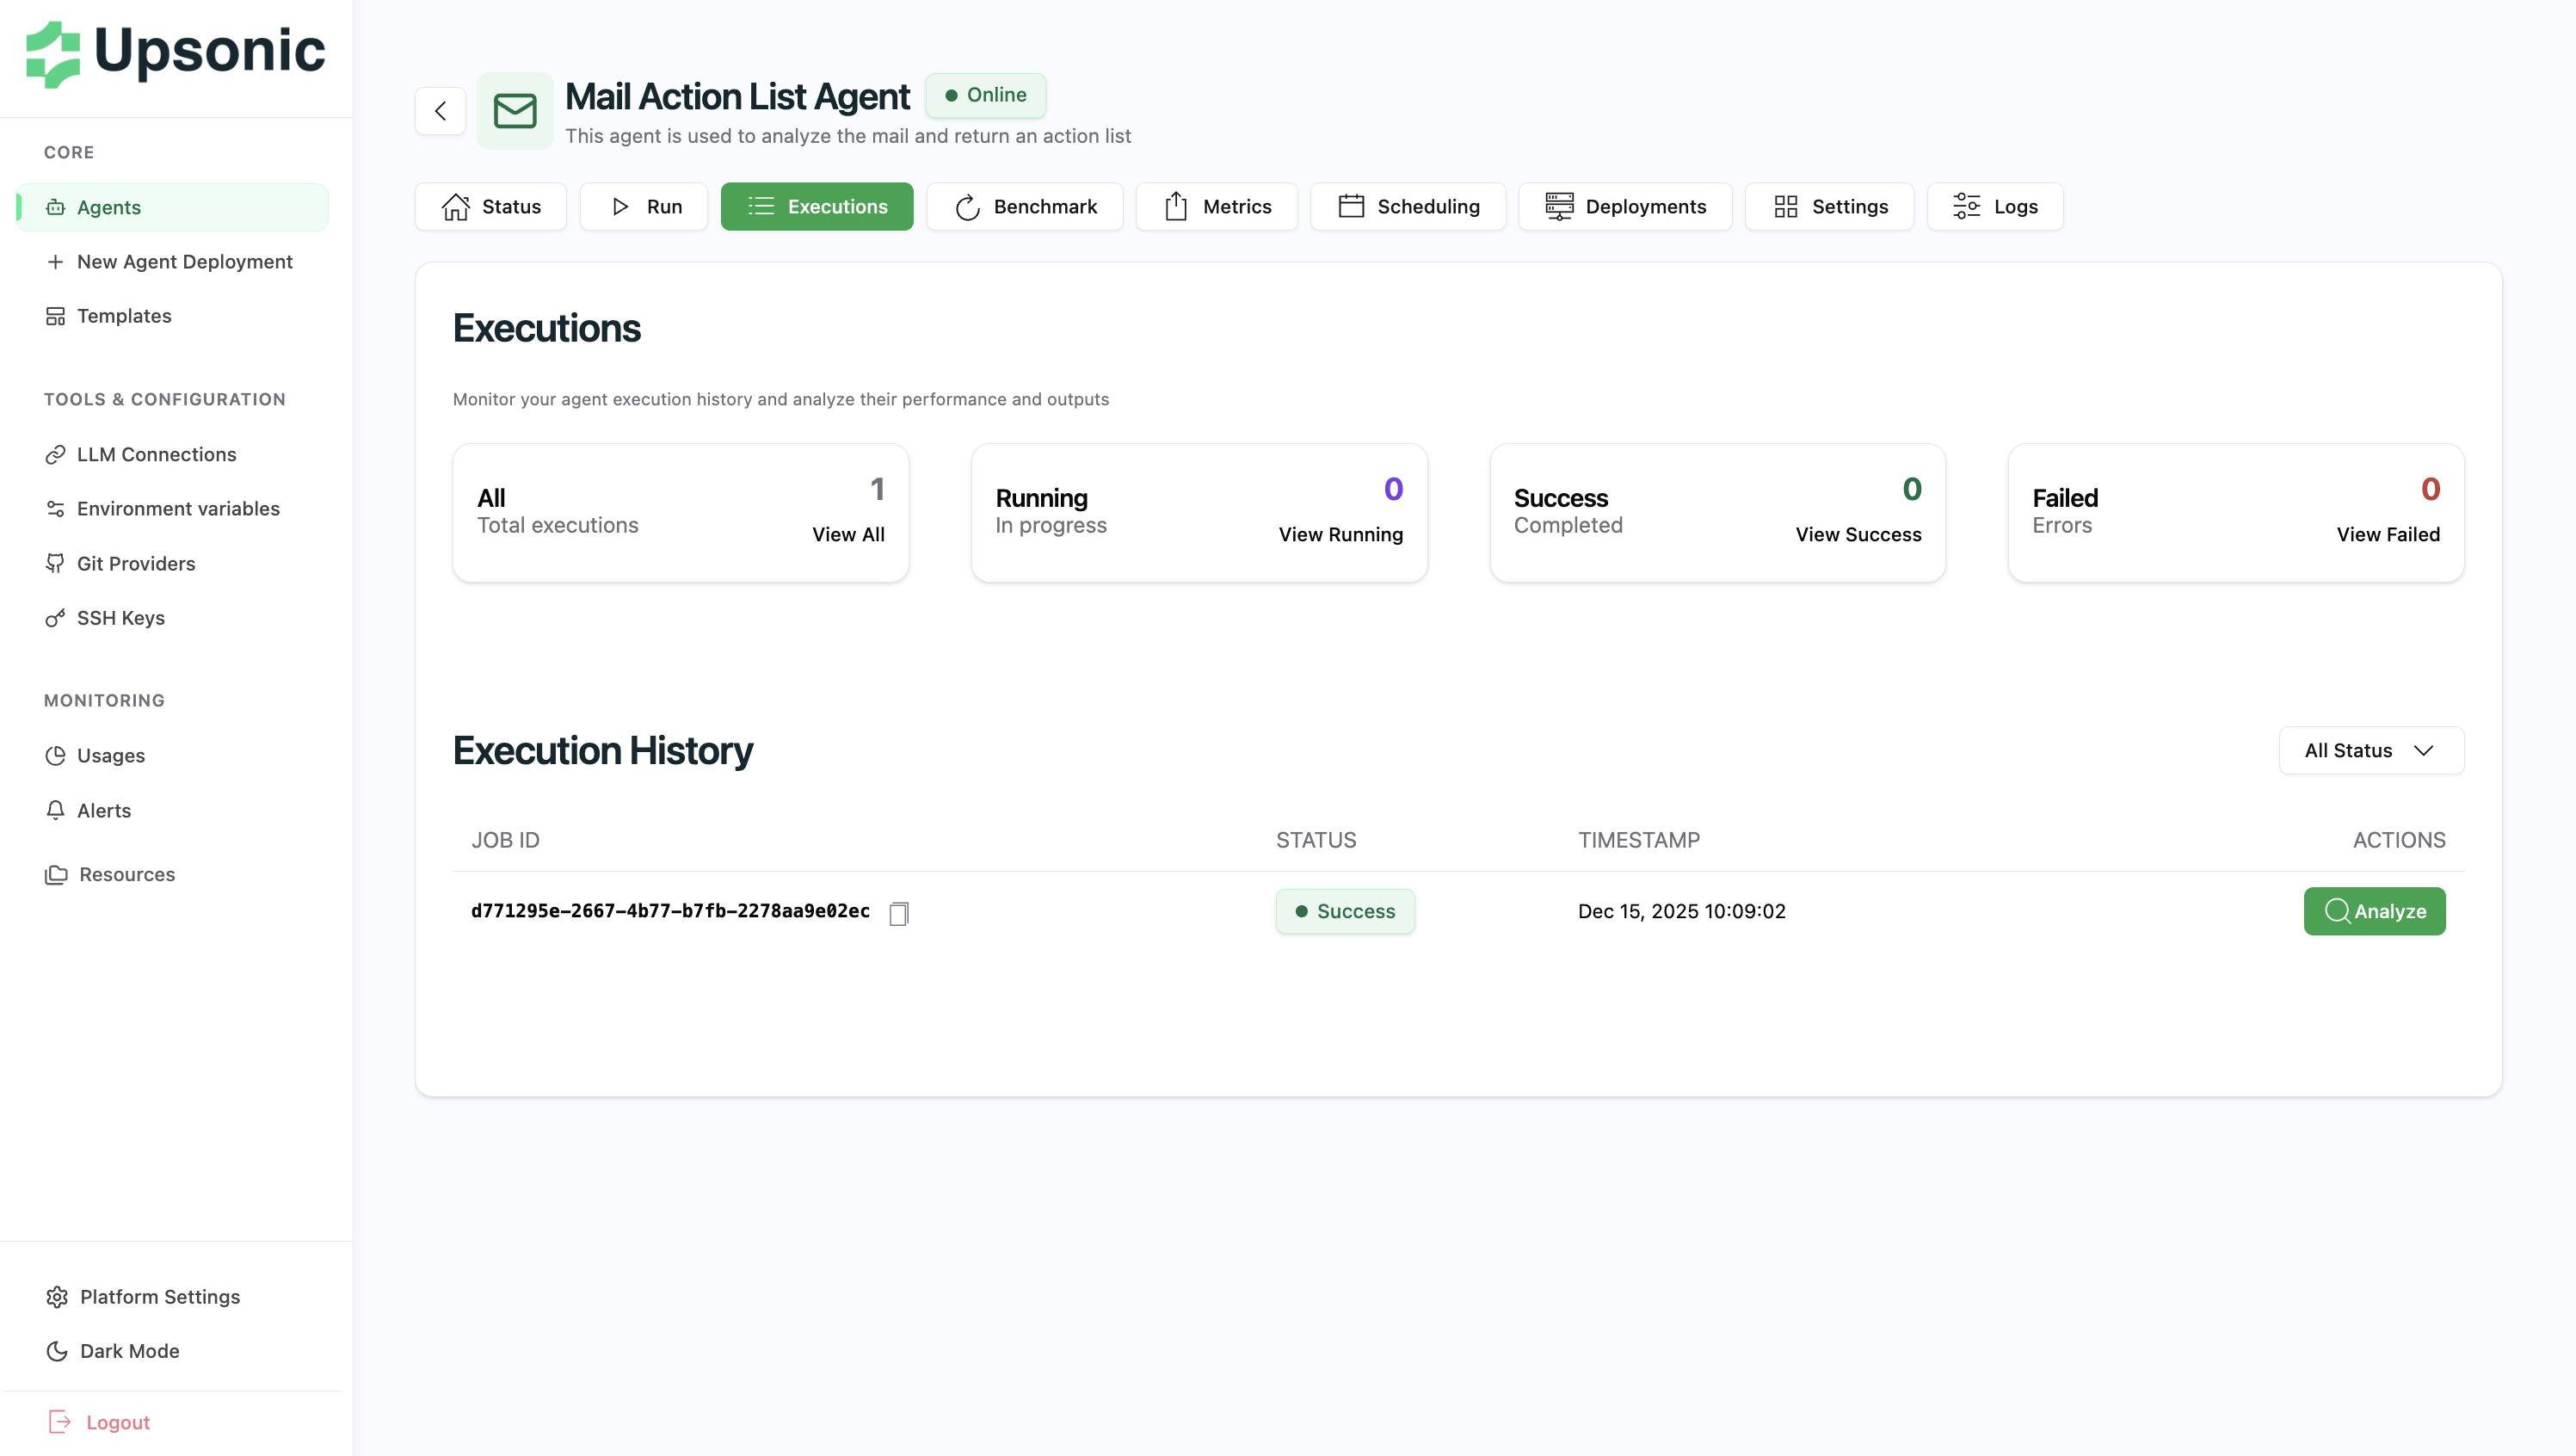
Executions
View the complete execution history of your agent, including:- Timestamp of each execution
- Input parameters
- Output results
- Execution duration
- Success/failure status
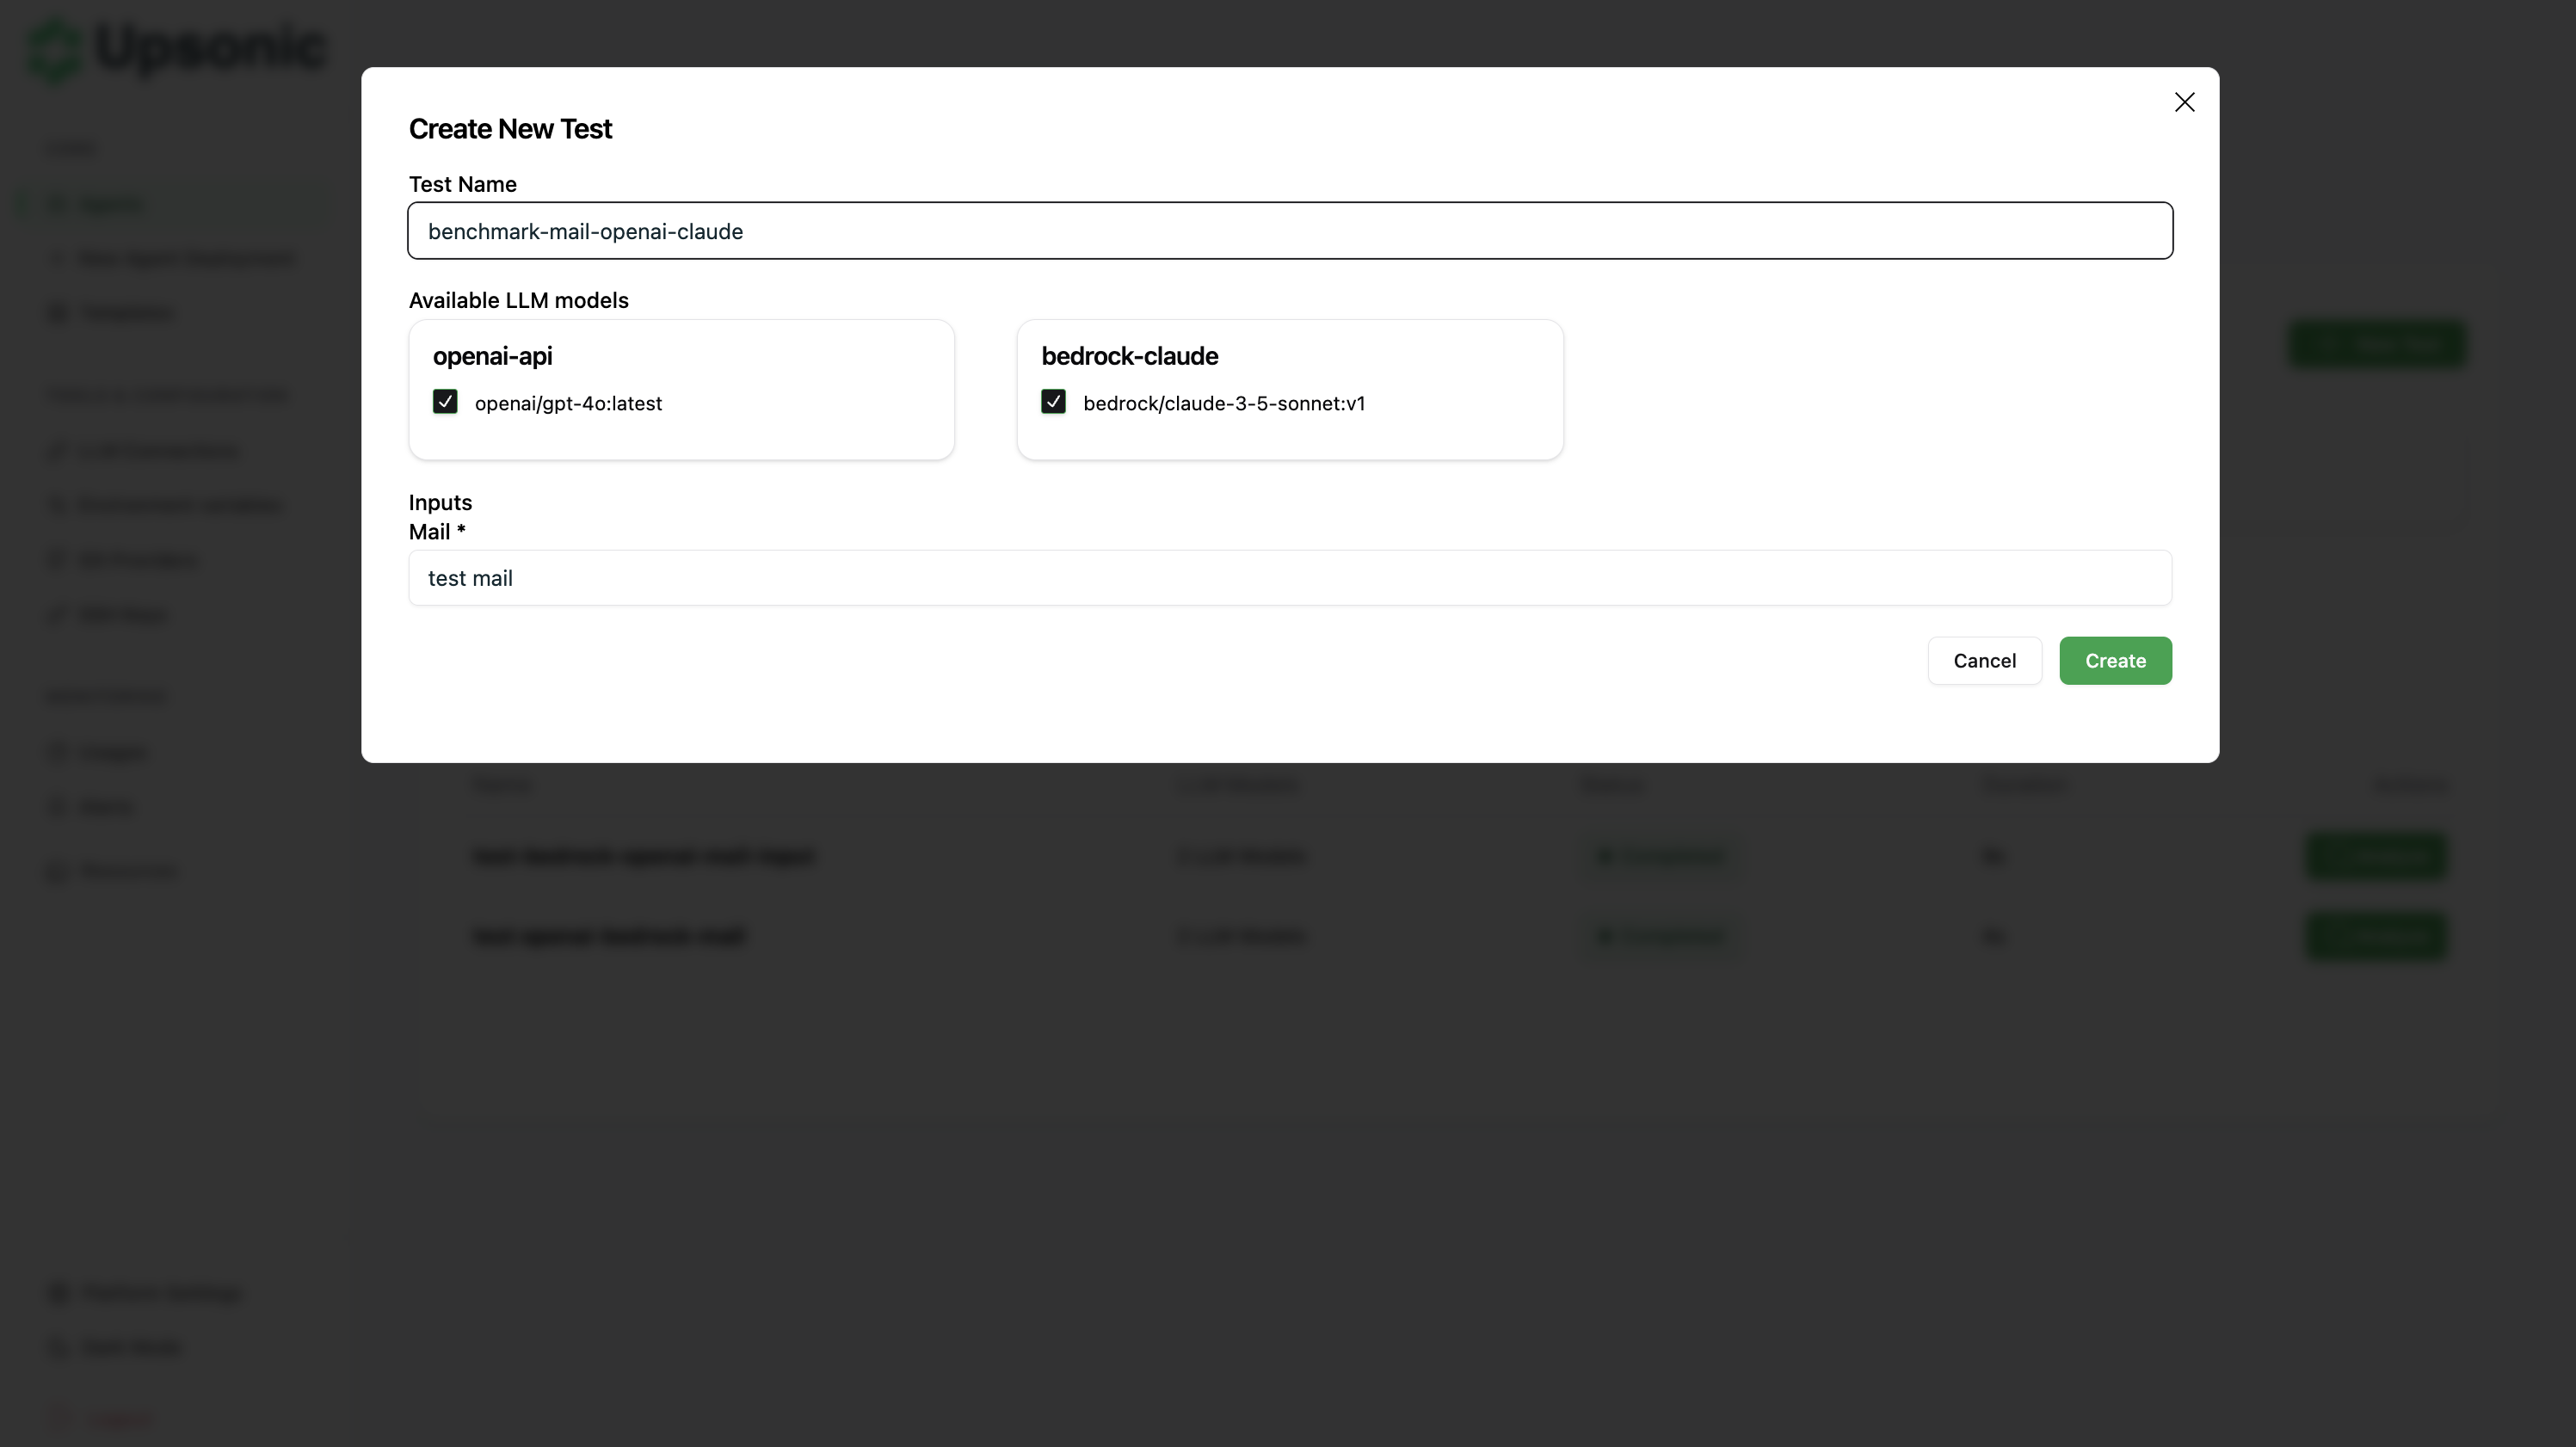
Benchmark
Compare your agent’s performance across different LLM models to find the optimal configuration.How It Works
- Select multiple LLM connections (configured in Settings)
- Provide the same input parameters
- AgentOS calls your agent with each model
- Compare results side-by-side
What You Can Compare
- Cost - API costs for each model
- Response Time - Inference speed comparison
- Token Usage - Token consumption analysis
- Output Quality - Manual comparison of responses
Results View
After running the benchmark, view detailed comparison results for each model: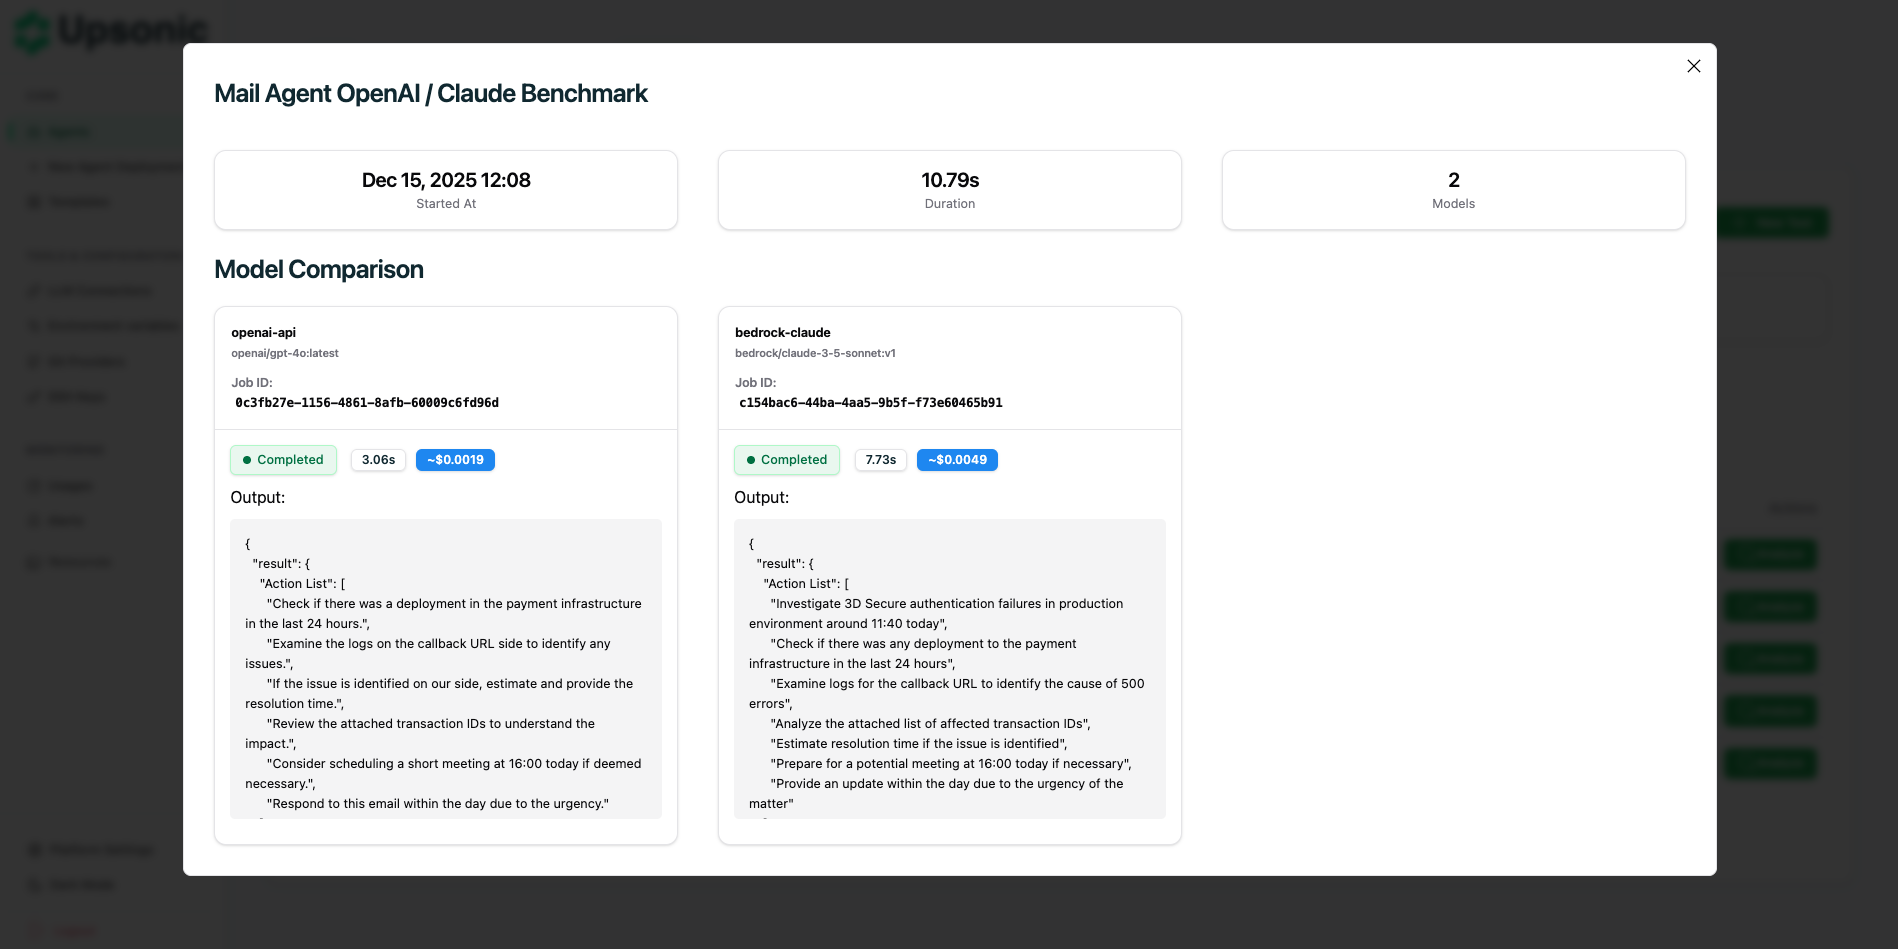
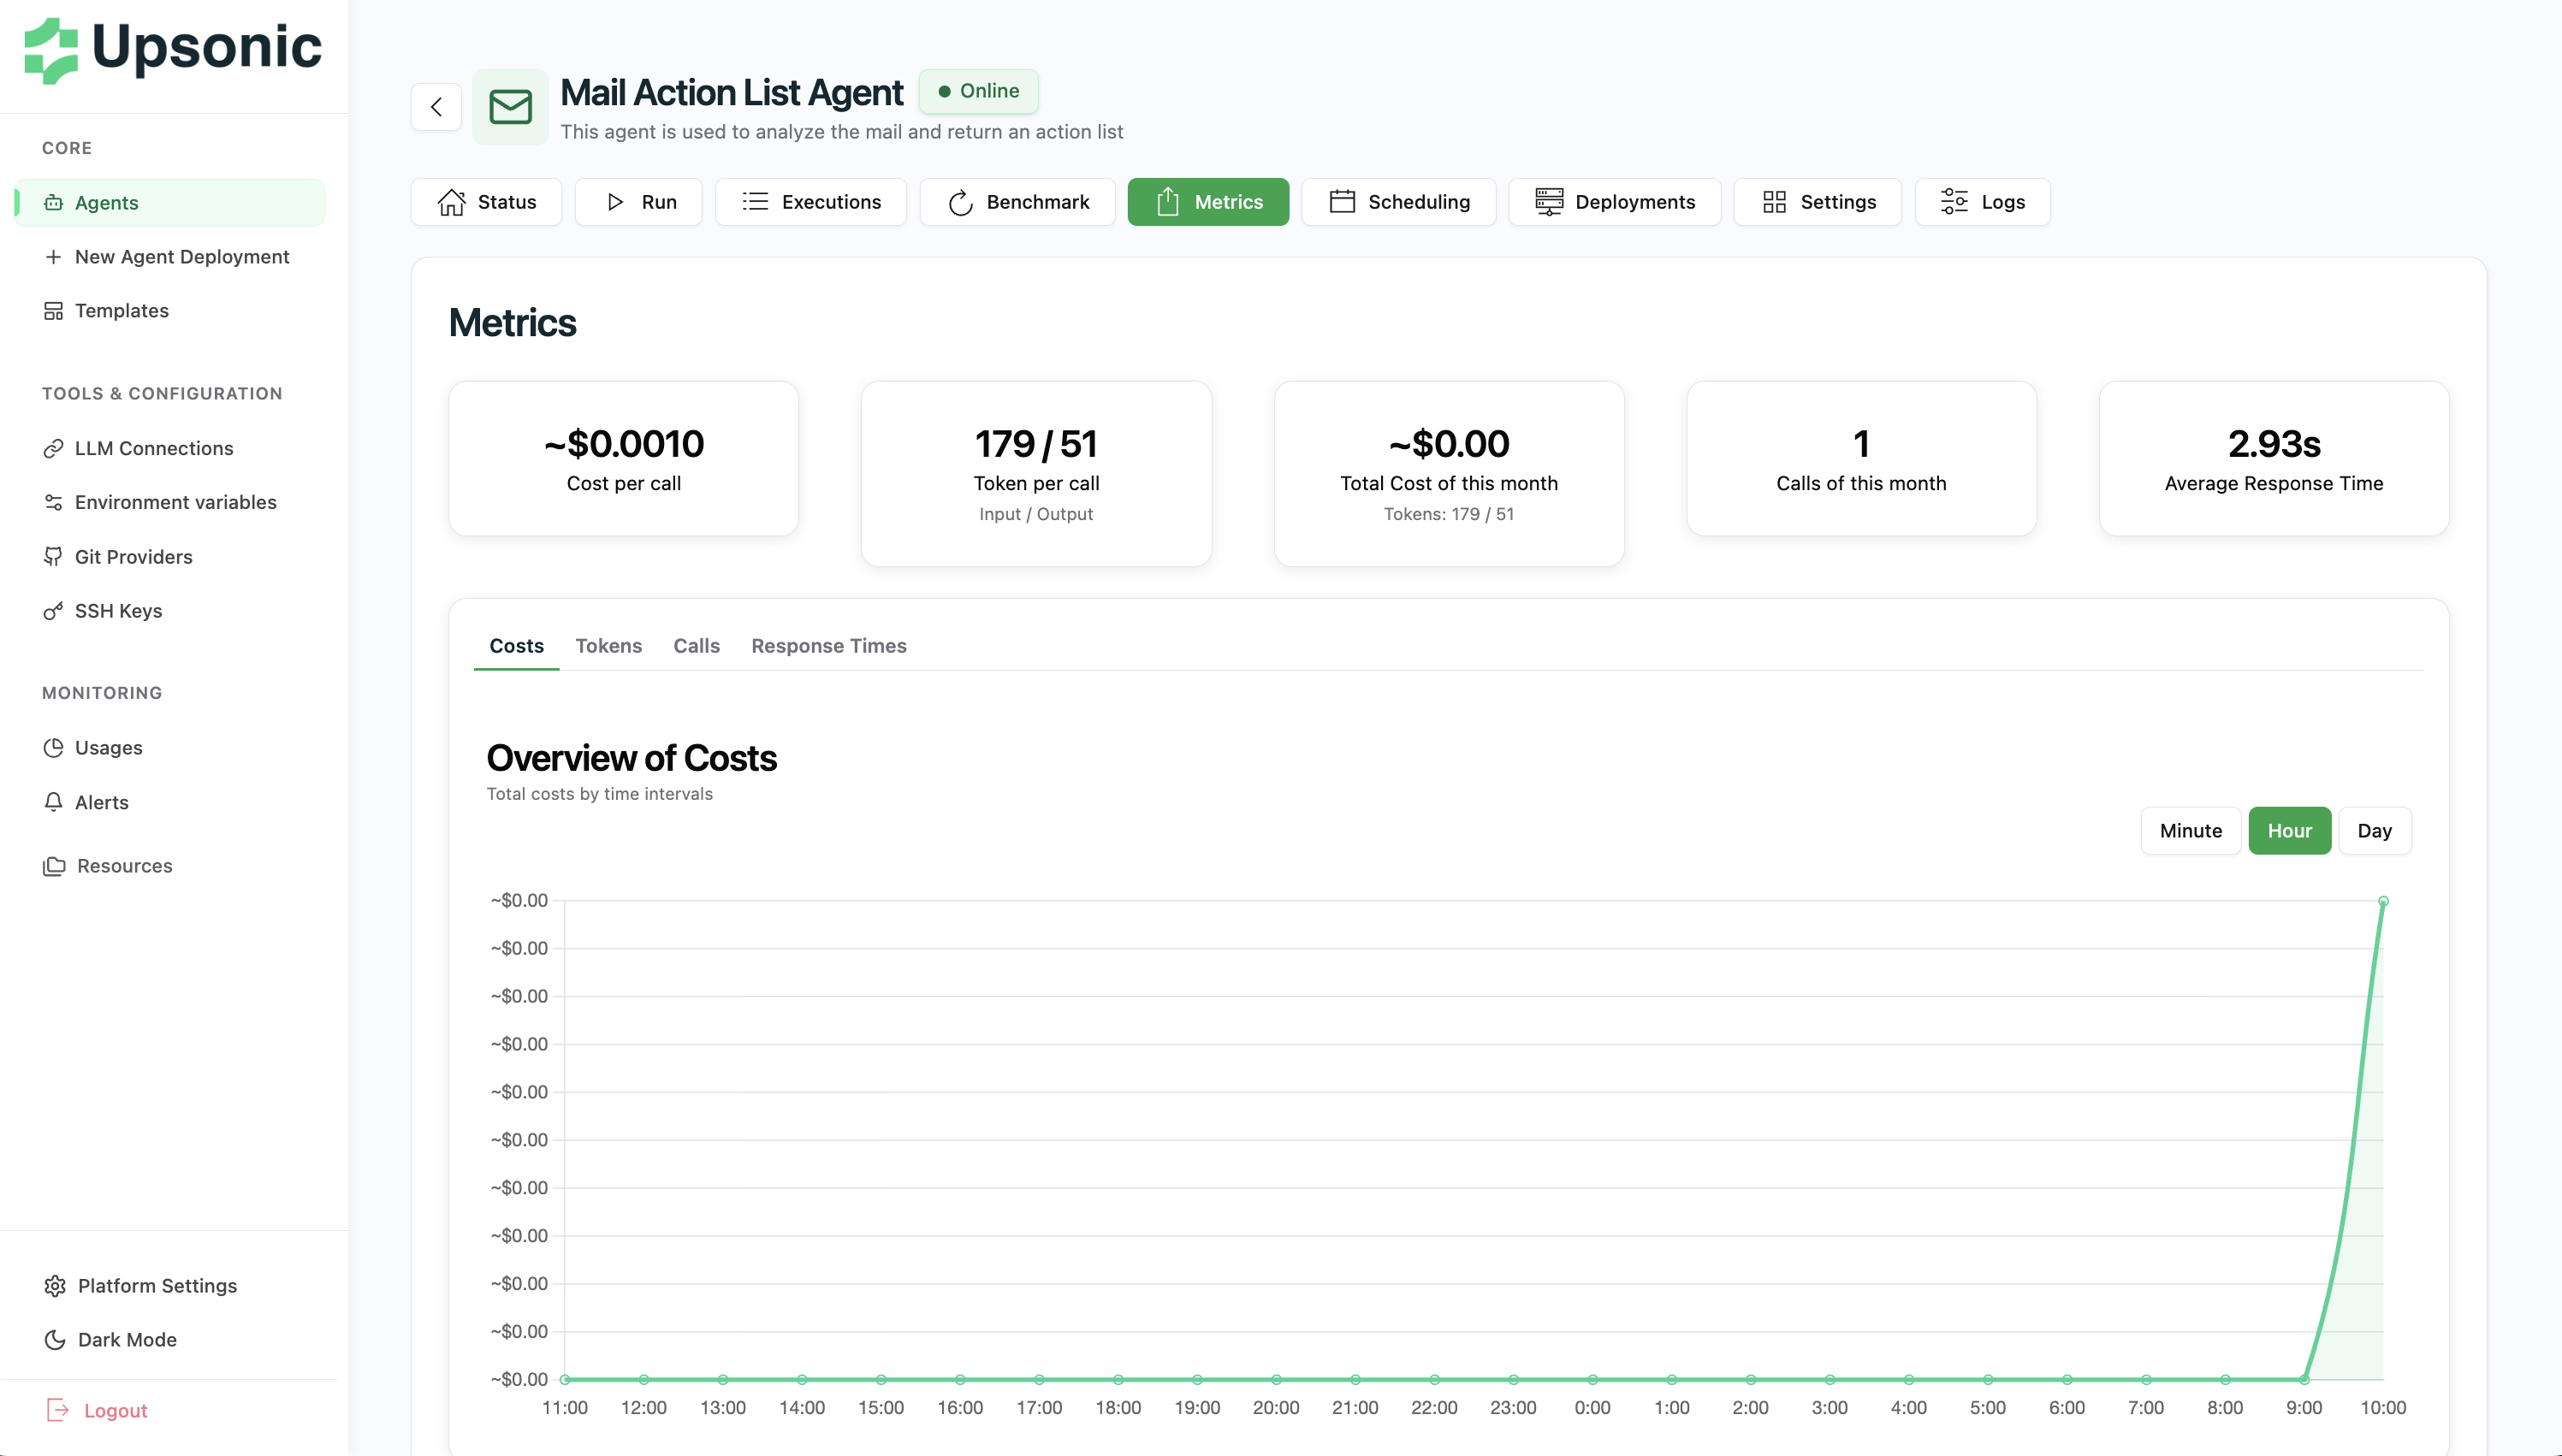
Metrics
Monitor your agent’s performance with detailed metrics and visualizations. AgentOS automatically tracks:- Total Calls - Number of executions
- Total Cost - Cumulative API costs
- Average Response Time - Performance trends
- Token Usage - Input and output tokens
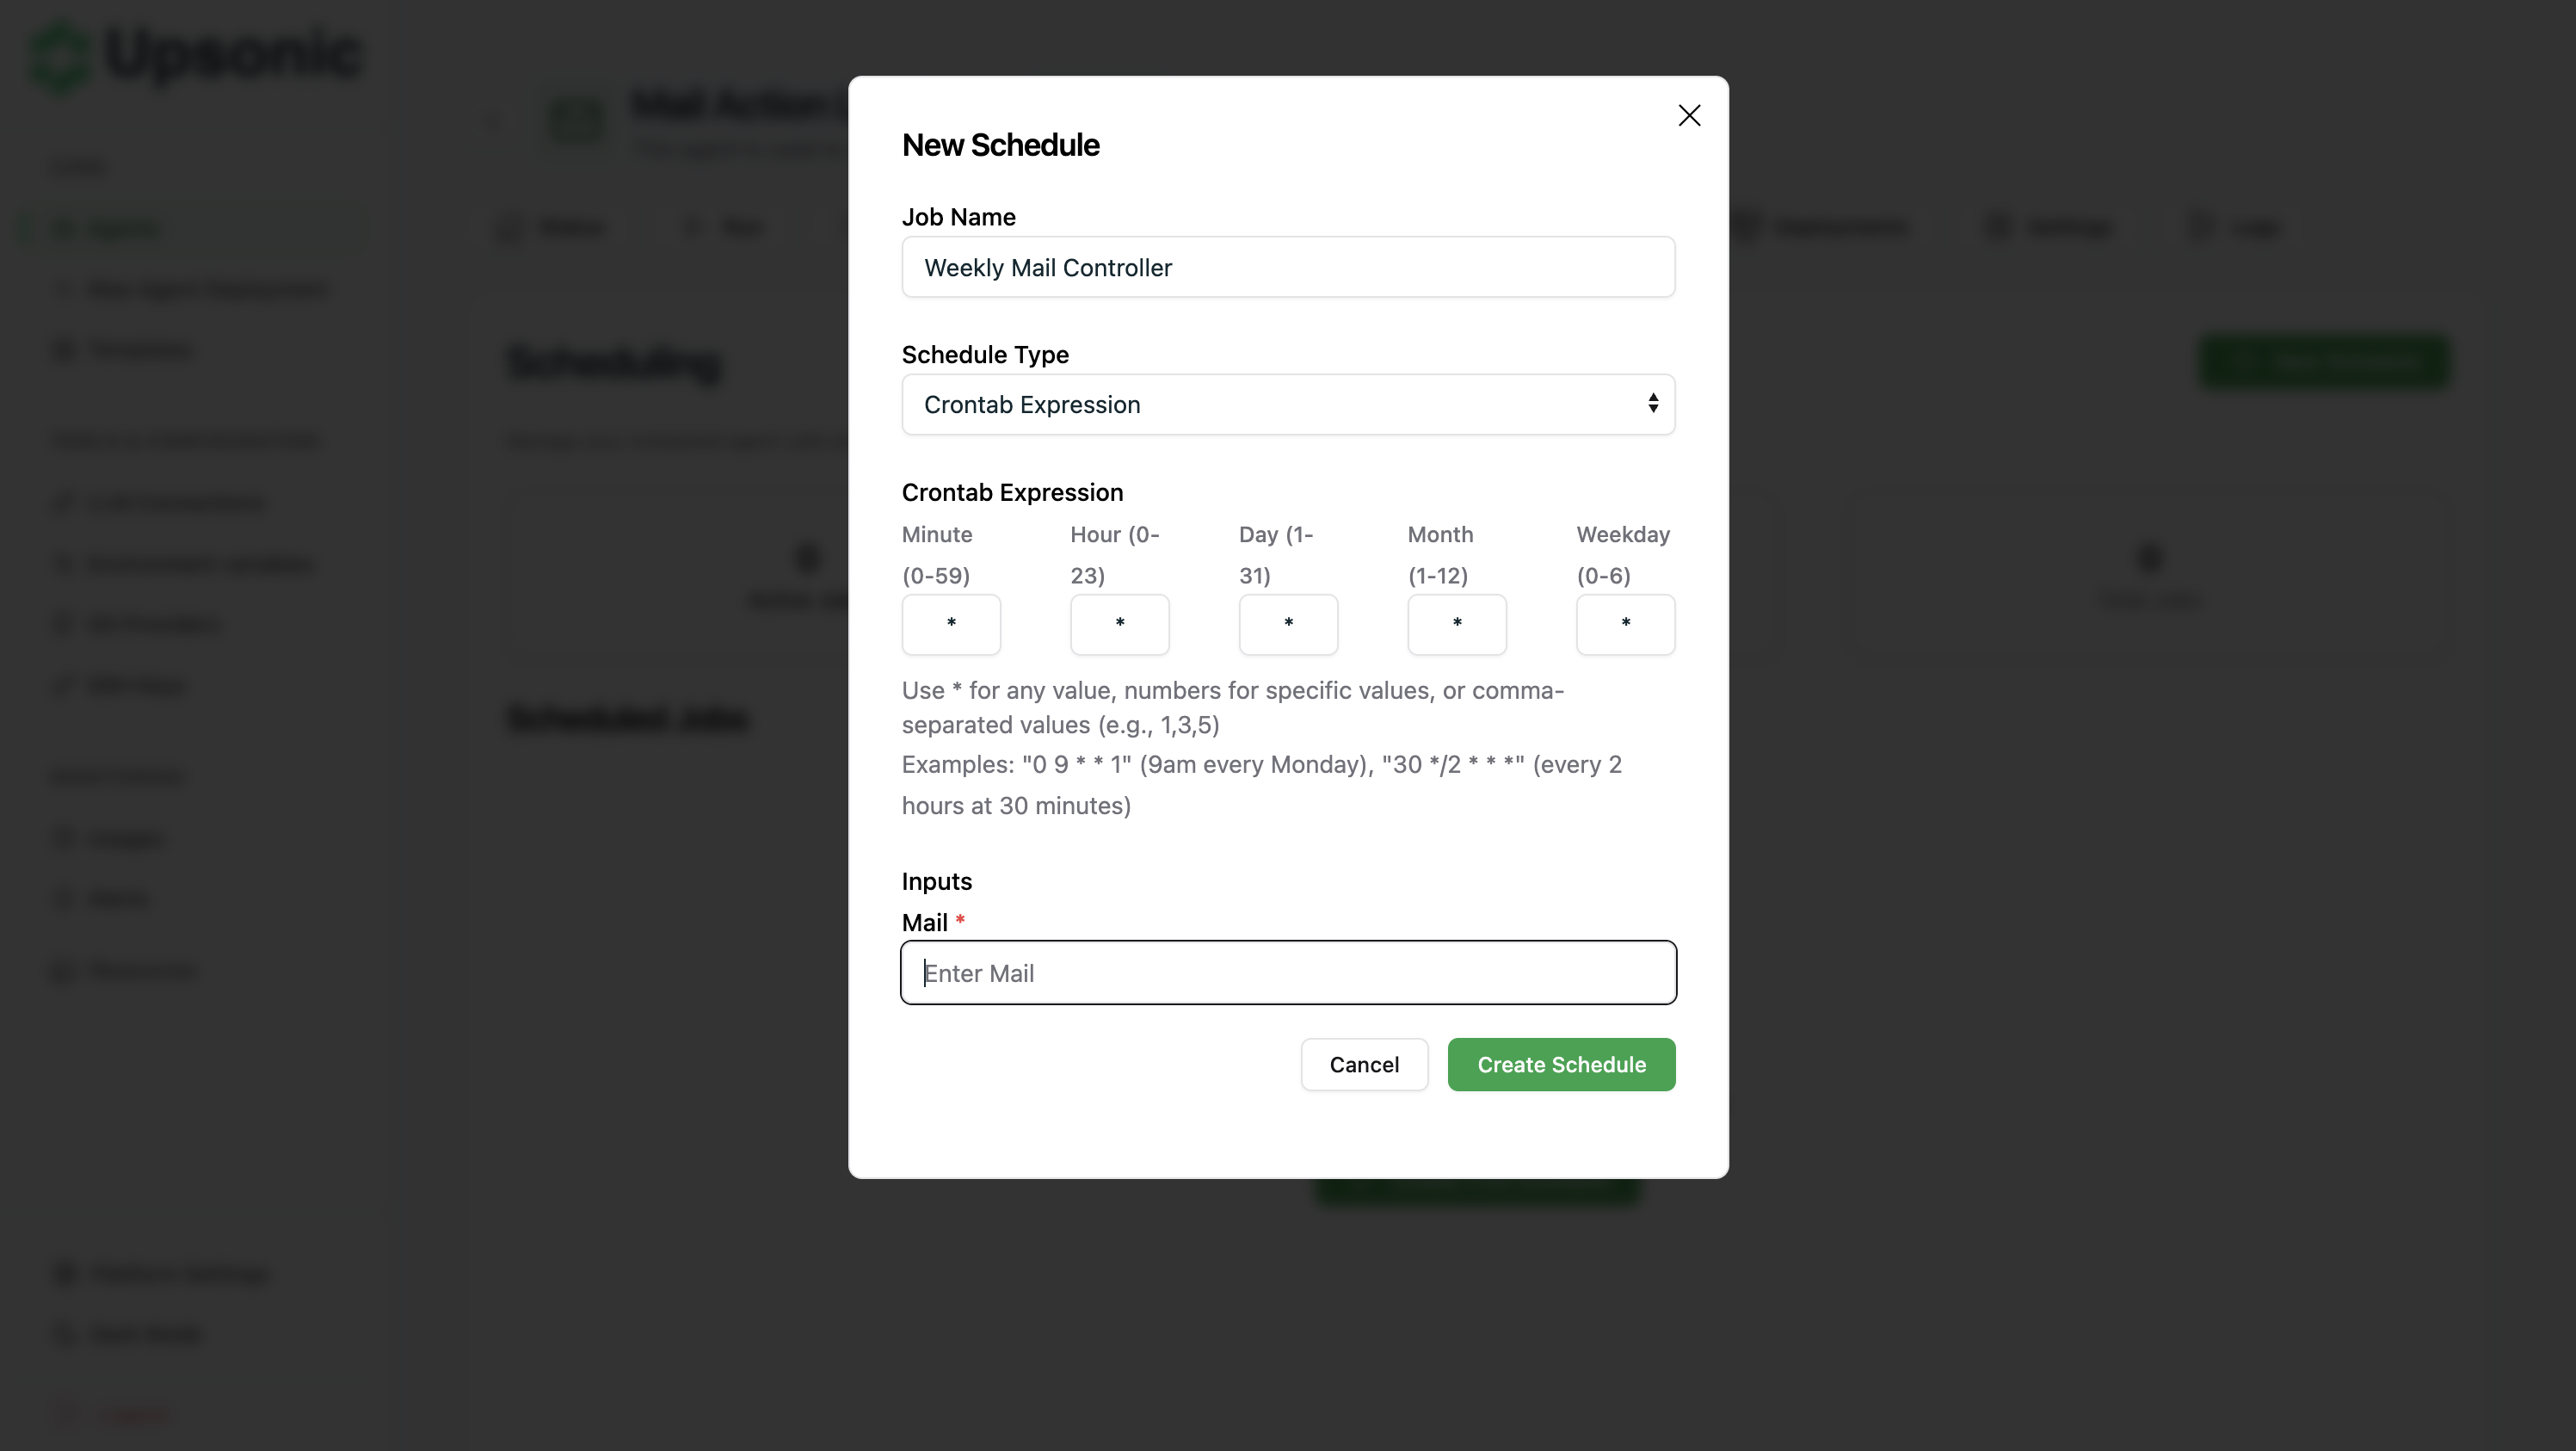
Scheduling
Automate agent execution with flexible scheduling options. Configure your agent to run automatically at specific times or intervals using:- Frequency-Based - Hourly, daily, or weekly execution
- Crontab Expression - Custom schedules with cron syntax
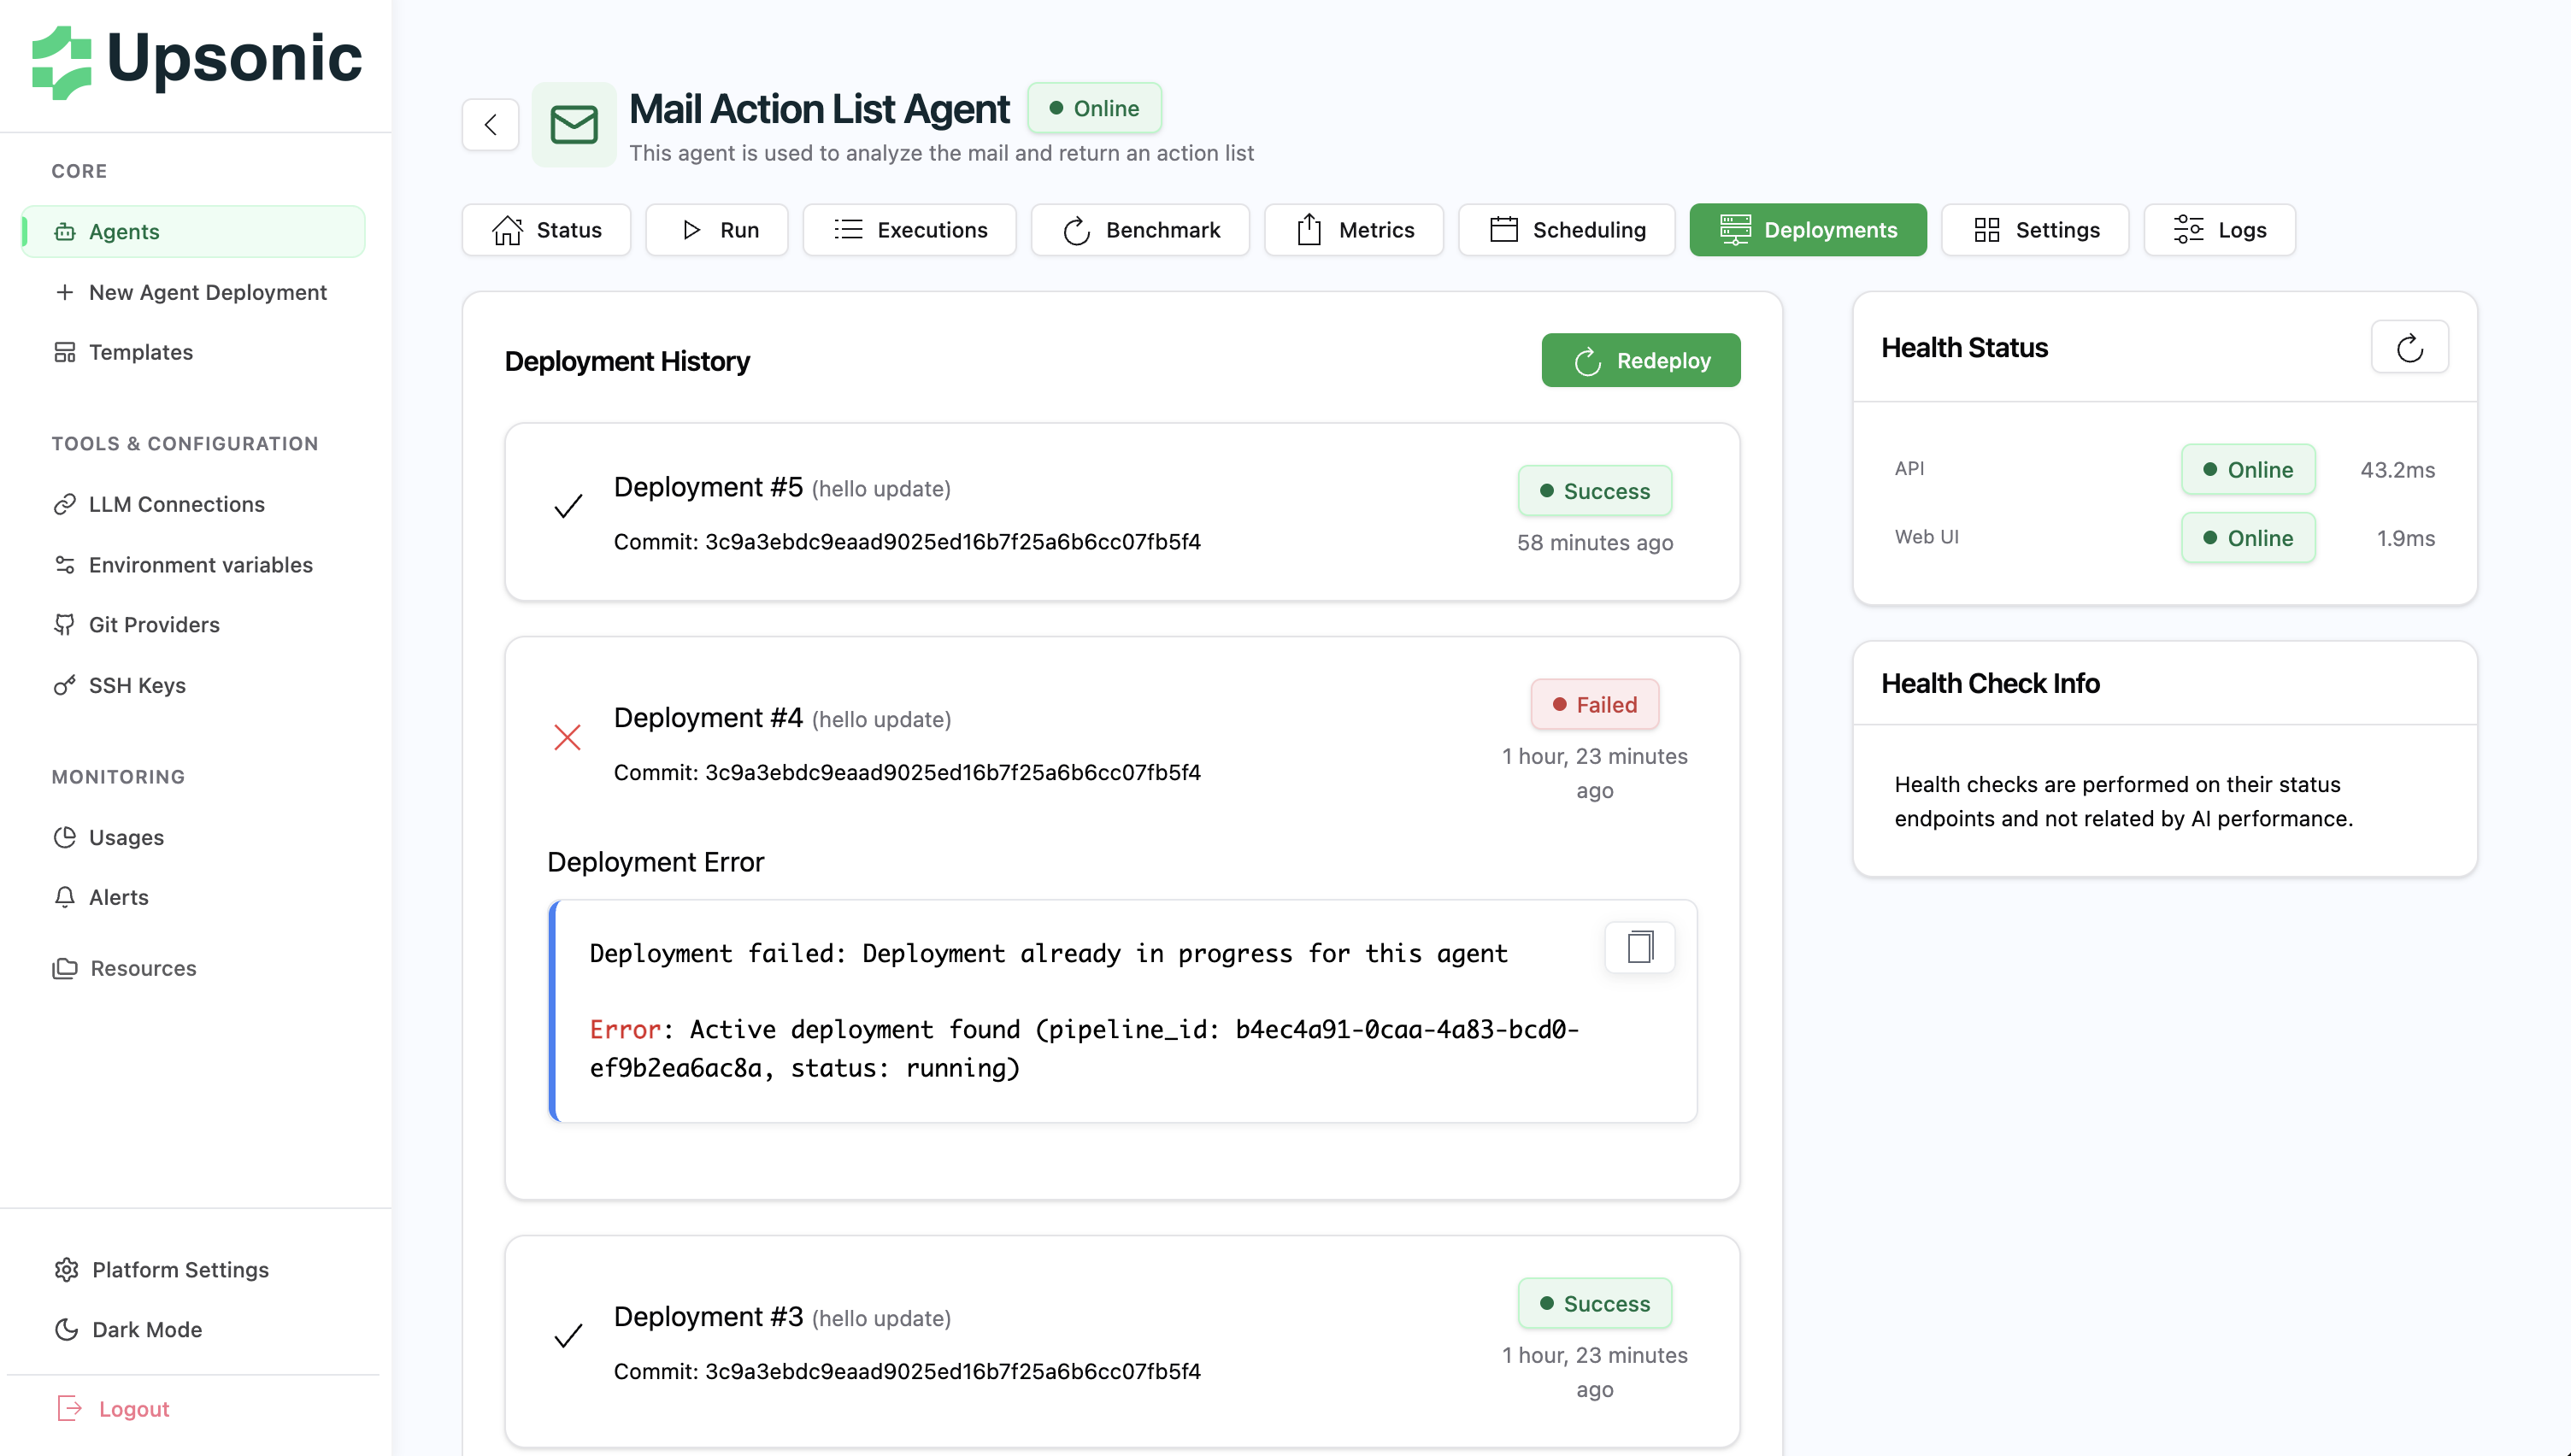
Deployments
Track your agent’s deployment history and monitor deployment status.Deployment History
View all deployments with:- Deployment Status - Success or failure
- Timestamp - When the deployment occurred
- Commit Hash - Git commit used for deployment (helps identify which code version is running)
- Failure Reasons - Detailed error messages for failed deployments